File:TransportationConnections2.png
Original file (2,084 × 1,147 pixels, file size: 106 KB, MIME type: image/png)
Summary
Source: Claude
pip install matplotlib --break-system-packages -q && python3 << 'EOF' import matplotlib matplotlib.use('Agg') import matplotlib.pyplot as plt import matplotlib.patches as mpatches from matplotlib.ticker import MultipleLocator
COLORS = {
   'voyageur': '#7EC8F8',
   'steamship': '#1D6FBF',
   'air':       '#8B9099',
   'road':      '#1E293B',
   'rail':      '#C83030',
   'cargo':     '#E07878',
}
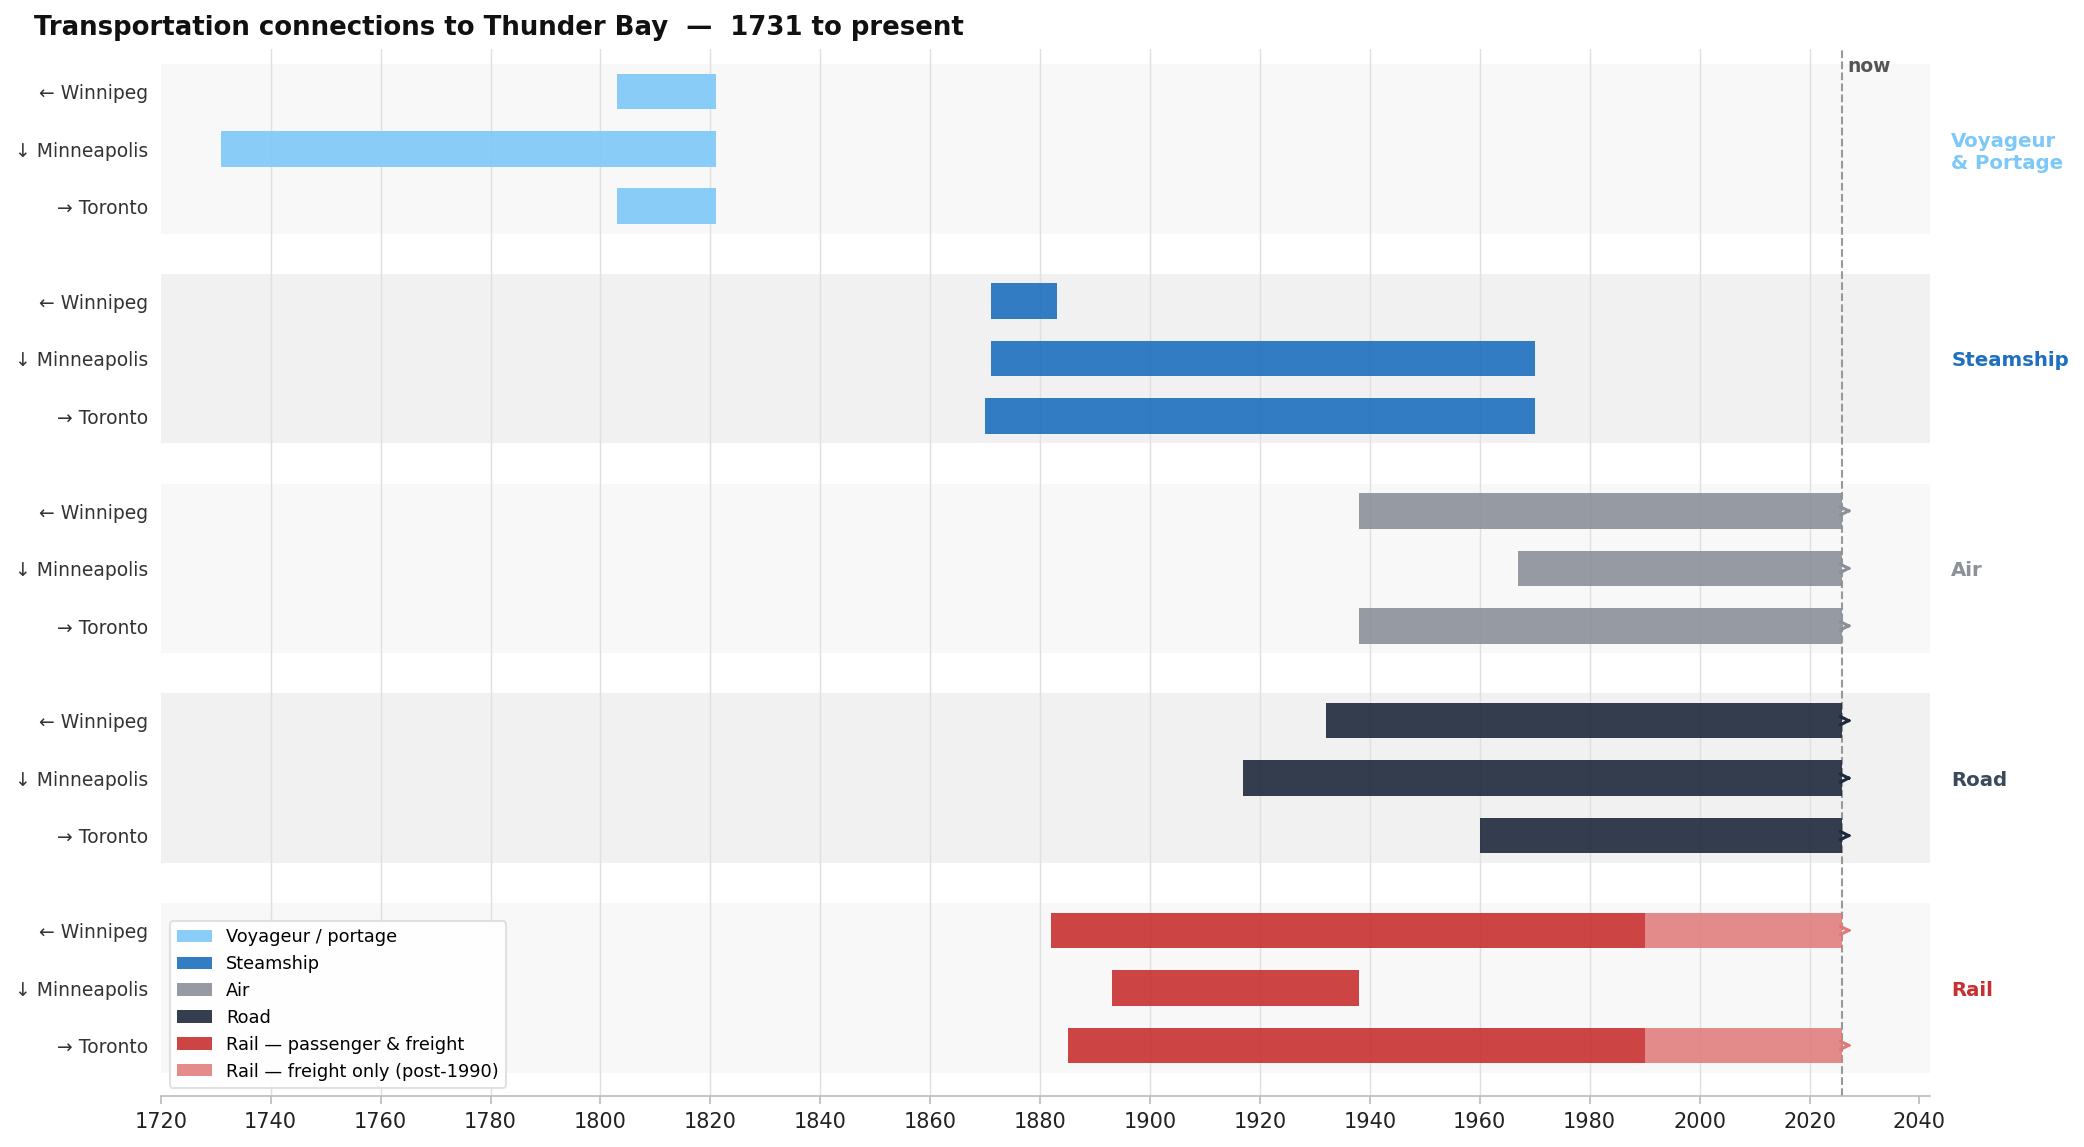
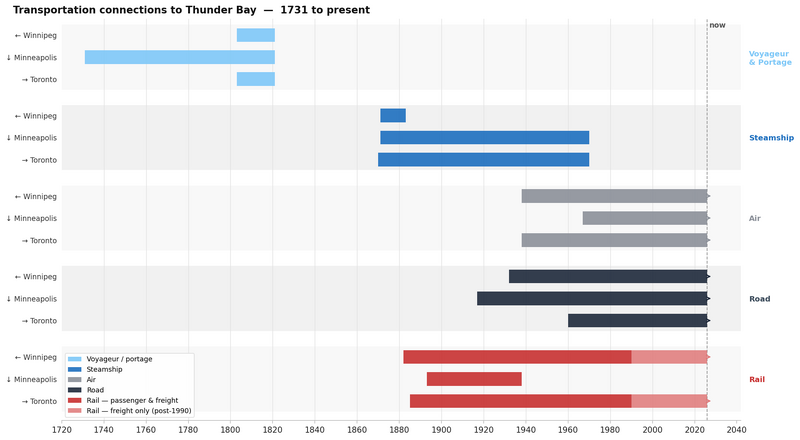
NOW, XMIN, XMAX = 2026, 1720, 2042
data = [
   {'mode': 'Voyageur\n& Portage', 'color': COLORS['voyageur'], 'lanes': [
       {'d': '\u2190 Winnipeg',    's': 1803, 'e': 1821},
       {'d': '\u2193 Minneapolis', 's': 1731, 'e': 1821},
       {'d': '\u2192 Toronto',     's': 1803, 'e': 1821},
   ]},
   {'mode': 'Steamship', 'color': COLORS['steamship'], 'lanes': [
       {'d': '\u2190 Winnipeg',    's': 1871, 'e': 1883},
       {'d': '\u2193 Minneapolis', 's': 1871, 'e': 1970},
       {'d': '\u2192 Toronto',     's': 1870, 'e': 1970},
   ]},
   {'mode': 'Air', 'color': COLORS['air'], 'lanes': [
       {'d': '\u2190 Winnipeg',    's': 1938, 'e': NOW},
       {'d': '\u2193 Minneapolis', 's': 1967, 'e': NOW},
       {'d': '\u2192 Toronto',     's': 1938, 'e': NOW},
   ]},
   {'mode': 'Road', 'color': COLORS['road'], 'lanes': [
       {'d': '\u2190 Winnipeg',    's': 1932, 'e': NOW},
       {'d': '\u2193 Minneapolis', 's': 1917, 'e': NOW},
       {'d': '\u2192 Toronto',     's': 1960, 'e': NOW},
   ]},
   {'mode': 'Rail', 'color': COLORS['rail'], 'lanes': [
       {'d': '\u2190 Winnipeg',    's': 1882, 'e': 1990, 'cargo_e': NOW},
       {'d': '\u2193 Minneapolis', 's': 1893, 'e': 1938},
       {'d': '\u2192 Toronto',     's': 1885, 'e': 1990, 'cargo_e': NOW},
   ]},
]
LH, LP, GG = 0.62, 0.18, 0.52
fig, ax = plt.subplots(figsize=(14, 7.8)) fig.patch.set_facecolor('white') ax.set_facecolor('white')
y = 0.0 lane_ys, group_info = [], []
for gi, grp in enumerate(data):
   g_top = y
   ys = []
   for lane in grp['lanes']:
       cy = y + LH / 2
       ys.append(cy)
       lane_ys.append(cy)
       y += LH + LP
   g_bot = y - LP
   group_info.append({'ys': ys, 'top': g_top, 'bot': g_bot,
                      'mid': (g_top + g_bot) / 2,
                      'mode': grp['mode'], 'color': grp['color']})
   if gi < len(data) - 1:
       y += GG
total_h = y ax.set_ylim(total_h + 0.22, -0.28) ax.set_xlim(XMIN, XMAX)
- Alternating group bands
for i, gi in enumerate(group_info):
   fc = '#F8F8F8' if i % 2 == 0 else '#F1F1F1'
   ax.axhspan(gi['top'] - 0.07, gi['bot'] + 0.07, facecolor=fc, zorder=0, lw=0)
- Decade grid
for yr in range(1740, 2021, 20):
ax.axvline(yr, color='#E6E6E6', lw=0.7, zorder=1)
- "Now" dashed line
ax.axvline(NOW, color='#BBBBBB', lw=1.0, ls='--', zorder=1) ax.text(NOW + 0.8, -0.17, 'now', fontsize=8, color='#AAAAAA', va='top')
- Bars
all_lane_labels = [] for gi, grp in enumerate(data):
   gi_info = group_info[gi]
   for li, lane in enumerate(grp['lanes']):
       cy = gi_info['ys'][li]
       bh = LH * 0.8
       all_lane_labels.append(lane['d'])
       ax.barh(cy, lane['e'] - lane['s'], left=lane['s'],
               height=bh, color=grp['color'], alpha=0.9, zorder=2, linewidth=0)
       if lane['e'] >= NOW:
           ax.annotate(, xy=(lane['e'] + 2.5, cy), xytext=(lane['e'], cy),
                       arrowprops=dict(arrowstyle='->', color=grp['color'],
                                       lw=1.5, mutation_scale=10), zorder=3)
       if 'cargo_e' in lane:
           ax.barh(cy, lane['cargo_e'] - lane['e'], left=lane['e'],
                   height=bh, color=COLORS['cargo'], alpha=0.85, zorder=2, linewidth=0)
           ax.annotate(, xy=(lane['cargo_e'] + 2.5, cy), xytext=(lane['cargo_e'], cy),
                       arrowprops=dict(arrowstyle='->', color=COLORS['cargo'],
                                       lw=1.5, mutation_scale=10), zorder=3)
- Left y-axis: direction labels
ax.set_yticks(lane_ys) ax.set_yticklabels(all_lane_labels, fontsize=9, color='#505050') ax.yaxis.set_tick_params(length=0, pad=6)
- Right y-axis: group labels
ax2 = ax.twinx() ax2.set_ylim(ax.get_ylim()) ax2.set_yticks([gi['mid'] for gi in group_info]) ax2.set_yticklabels([gi['mode'] for gi in group_info],
fontsize=9.5, fontweight='bold')
ax2.yaxis.set_tick_params(length=0, pad=10) for tick, gi in zip(ax2.yaxis.get_ticklabels(), group_info):
   c = gi['color']
   tick.set_color('#3A4A5A' if c == '#1E293B' else c)
- Spines
for spine in ['top', 'left', 'right']:
ax.spines[spine].set_visible(False)
ax.spines['bottom'].set_color('#D5D5D5') for spine in ax2.spines.values():
spine.set_visible(False)
ax.xaxis.set_major_locator(MultipleLocator(20)) ax.tick_params(axis='x', colors='#AAAAAA', labelsize=8.5, length=3, color='#D5D5D5')
- Title
fig.text(0.02, 0.975,
        'Transportation connections to Thunder Bay  \u2014  1731 to present',
        fontsize=12.5, fontweight='bold', color='#111111', va='top')
- Legend
leg_handles = [
   mpatches.Patch(fc=COLORS['voyageur'], alpha=0.9, label='Voyageur / portage'),
   mpatches.Patch(fc=COLORS['steamship'], alpha=0.9, label='Steamship'),
   mpatches.Patch(fc=COLORS['air'],       alpha=0.9, label='Air'),
   mpatches.Patch(fc=COLORS['road'],      alpha=0.9, label='Road'),
   mpatches.Patch(fc=COLORS['rail'],      alpha=0.9, label='Rail — passenger & freight'),
   mpatches.Patch(fc=COLORS['cargo'],     alpha=0.85, label='Rail — freight only (post-1990)'),
] ax.legend(handles=leg_handles, loc='lower left', fontsize=8.5,
framealpha=0.97, edgecolor='#E5E5E5', bbox_to_anchor=(0.0, 0.0))
plt.tight_layout(rect=[0, 0, 1, 0.965]) plt.savefig('/mnt/user-data/outputs/thunder_bay_transport_timeline.png',
dpi=150, bbox_inches='tight', facecolor='white')
print('Saved.')
File history
Click on a date/time to view the file as it appeared at that time.
| Date/Time | Thumbnail | Dimensions | User | Comment | |
|---|---|---|---|---|---|
| current | 18:59, 28 May 2026 | | 2,084 × 1,147 (106 KB) | Admin (talk | contribs) | |
| 18:49, 28 May 2026 | 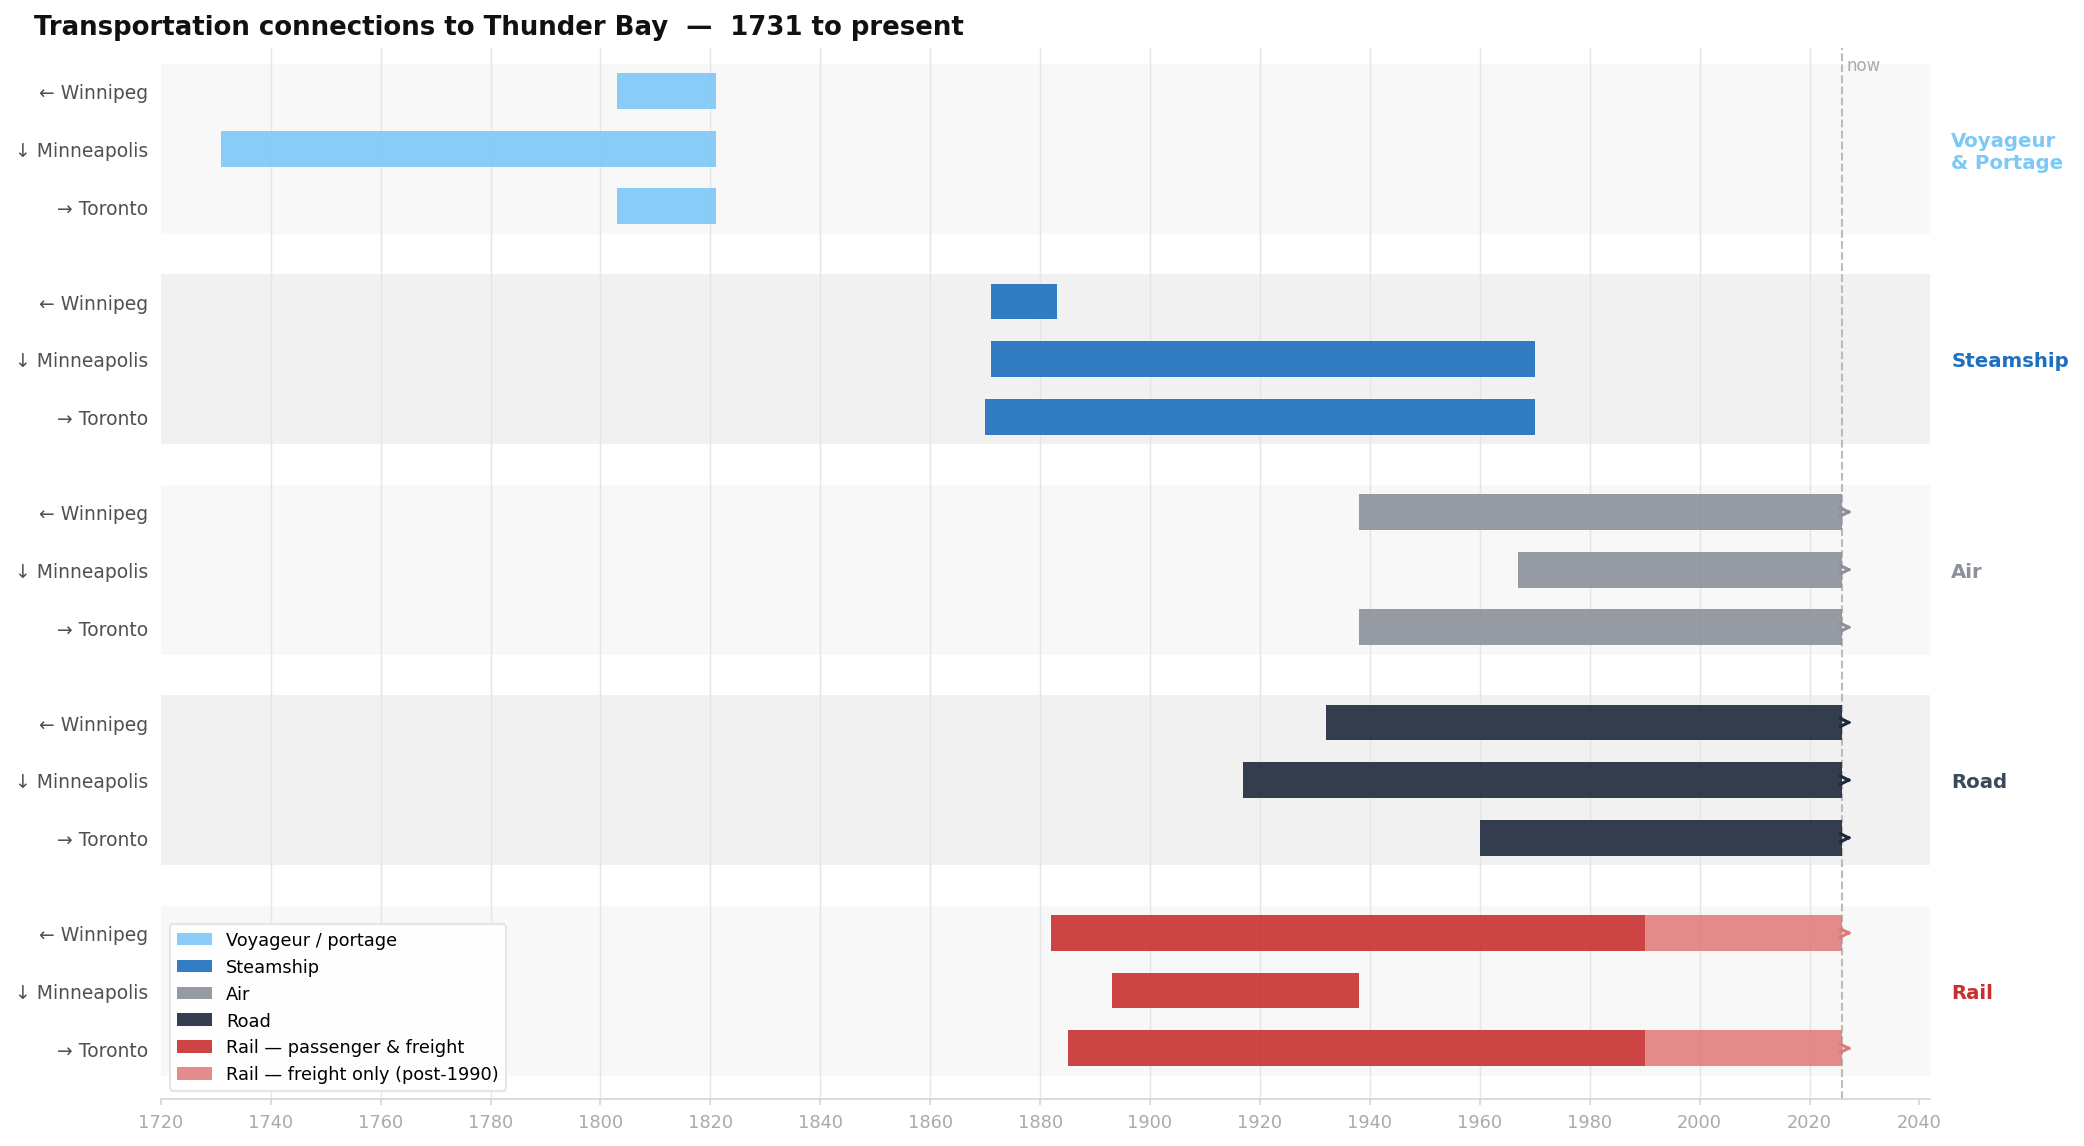 | 2,084 × 1,146 (103 KB) | Admin (talk | contribs) | Source: Claude pip install matplotlib --break-system-packages -q && python3 << 'EOF' import matplotlib matplotlib.use('Agg') import matplotlib.pyplot as plt import matplotlib.patches as mpatches from matplotlib.ticker import MultipleLocator COLORS = { 'voyageur': '#7EC8F8', 'steamship': '#1D6FBF', 'air': '#8B9099', 'road': '#1E293B', 'rail': '#C83030', 'cargo': '#E07878', } NOW, XMIN, XMAX = 2026, 1720, 2042 data = [ {'mode': 'Voyageur\n& Po... |
You cannot overwrite this file.
File usage
The following page uses this file: